
Adam P Gaspar*1, Paul Mitchell2, Shawn P Conley1
1Dept. of Agronomy, 2Dept. of Ag. & Applied Economics, University of Wisconsin, Madison
About the Author

Adam Gaspar is a graduate student in the Department of Agronomy at the University of Wisconsin, Madison, working under Shawn Conley, pursuing a doctorate in agronomy. His current research and Extension activities include many aspects of modern, Midwest soybean and wheat production. Gaspar’s research is very applied in nature and the resulting extension is targeted at the farm level where producers can immediately adopt research findings. The goal of my research is to increase crop production in an environmentally and economically sustainable fashion by improving crop management through the adoption of new practices and technologies.
Introduction
Earlier soybean planting coupled with increasing seed costs has led to a surge in the number of acres planted with seed treatments in the past decade (Esker and Conley, 2012). Yet, as commodity markets have softened recently, the return on investment (ROI) of seed treatments is even more vital to producers. Furthermore, the components and relative cost of various soybean seed treatments has broadened greatly. Recent studies have suggested that growers should consider lowering seeding rates to increase their return on investment (De Bruin and Pedersen, 2008; Epler and Staggenborg, 2008). This is attributed to the soybean plants’ potential compensatory ability at lower plant populations. Ultimately, growers would like to know the value proposition of combining seed treatments with lowered seeding rates. Therefore, the objectives of this study were to:
• Quantify the effects of seed treatments and seeding rates on soybean yield.
• Assess the economic risk and profitability of seed treatments and seeding rates, including the calculated economically optimal seeding rate (EOSR) for each seed treatment.
ApronMaxx RFC and CruiserMaxx (Syngenta Crop Protection) seed treatments were used to achieve these objectives because they differ in their components and relative cost per unit. This study was conducted in 2012 and 2013 at nine Wisconsin locations totaling 18 site-years. All locations were planted in 15-inch rows within the first three weeks of May.
Effects on Soybean Yield
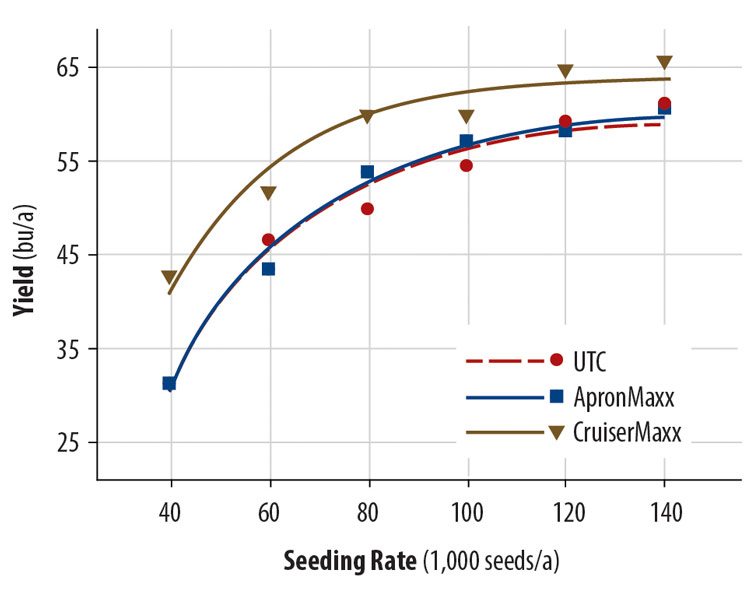
When pooled over all seed treatments, the highest seeding rate (140,000 seeds per acre) yielded 64 bushels per acre, which was significantly higher than all other seeding rates, except 120,000 seeds per acre. ApronMaxx showed no improvements in yield at any seeding rate compared to the untreated control (UTC), while CruiserMaxx provided increased yields at all seeding rates (Figure 1).
CruiserMaxx showed a trend of larger yield increases as the seeding rate was lowered. We observed a 4 percent and 12 percent yield increase at 140,000 and 40,000 seeds per acre a, respectively, over ApronMaxx and the UTC (Figure 1).

Profitability and Economic Risk
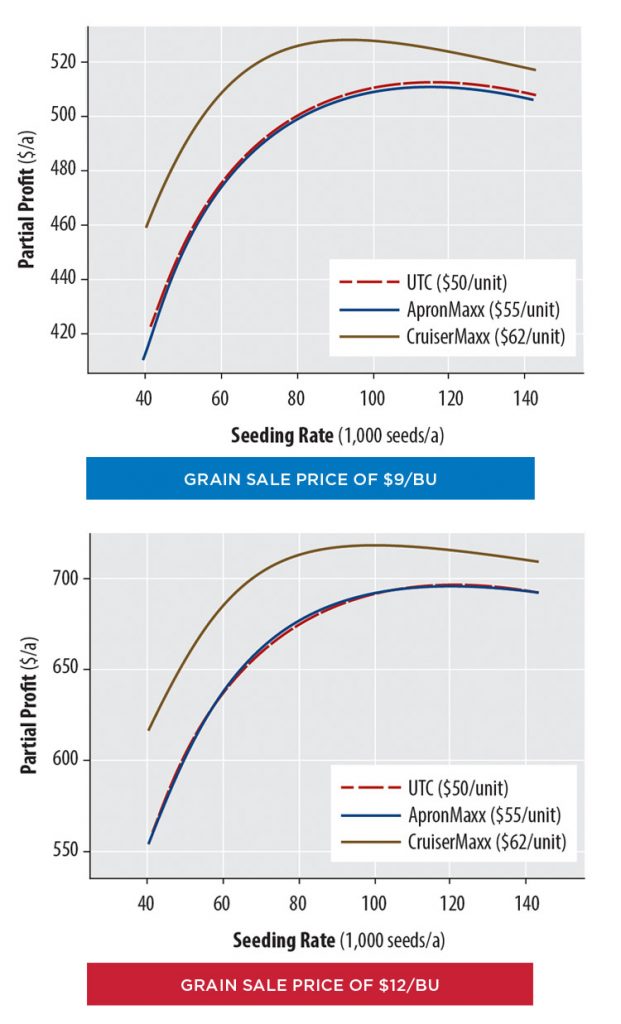
Partial profit was calculated as follows: (Yield x Grain Sale Price) – (Seed + Seed Treatment). CruiserMaxx increased profit at each grain sale price and across all seeding rates compared to ApronMaxx and the UTC (Figure 2). Again, no differences were observed between ApronMaxx and the UTC (Figure 2). The economically optimal seeding rates (EOSR), or the high point on the profit curves, for the three seed treatments and two grain sale prices are displayed at the bottom of Tables 1 and 2.
Economic risk was applied to the profit curves (Figure 2), where risk is measured as the break-even probability (the probability of breaking even relative to the base case of UTC at 140,000 seeds per acre) and displayed in Tables 1 and 2 for soybean grain sale prices of $9 and 12 per bushel, respectively. For example, in Table 1, CruiserMaxx at 140,000 seeds per acre had a 0.71 (71 percent chance) probability of increasing profit over the base case and on average for all outcomes (all environments), increased profit by $10 per acre. In addition, an average $18 per acre increase was observed for the positive outcomes and an average $11 per acre decrease for negative outcomes. The positive outcomes column represents responsive environments while the negative outcomes column represents non-responsive environments.
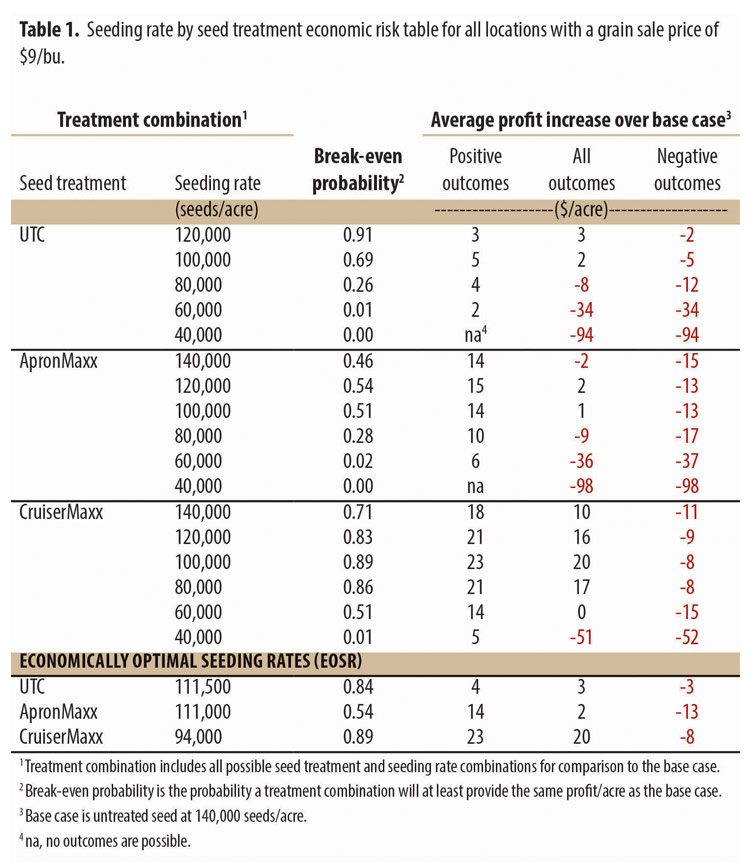
At a grain sale price of $9 per bushel (Table 1), ApronMaxx and the UTC obtained break-even probabilities greater than 0.50 at seeding rates of 100,000 and 120,000 seeds per acre. However, the average profit increases for all outcomes was minimal (less than $3 per acre). At this grain sale price, UTC at 120,000 seeds per acre had the lowest risk (0.91) of any treatment combination in Table 1, but again provided a relatively low average profit increase for all outcomes ($3 per acre). Using seeding rates below 100,000 seeds per acre was very risky for ApronMaxx and the UTC; showing break-even probabilities less than 0.50 and negative average profit increases for all outcomes. CruiserMaxx produced break-even probabilities greater than 0.50 for all seeding rates except at 40,000 seeds per acre and the average profit increase for all outcomes was greater than $17 per acre at seeding rate between 80,000 and 120,000 seeds per acre. Furthermore, the lowest risk (0.89) and largest average profit increase for all outcomes ($20 per acre) with CruiserMaxx was at its EOSR (94,000 seeds per acre).
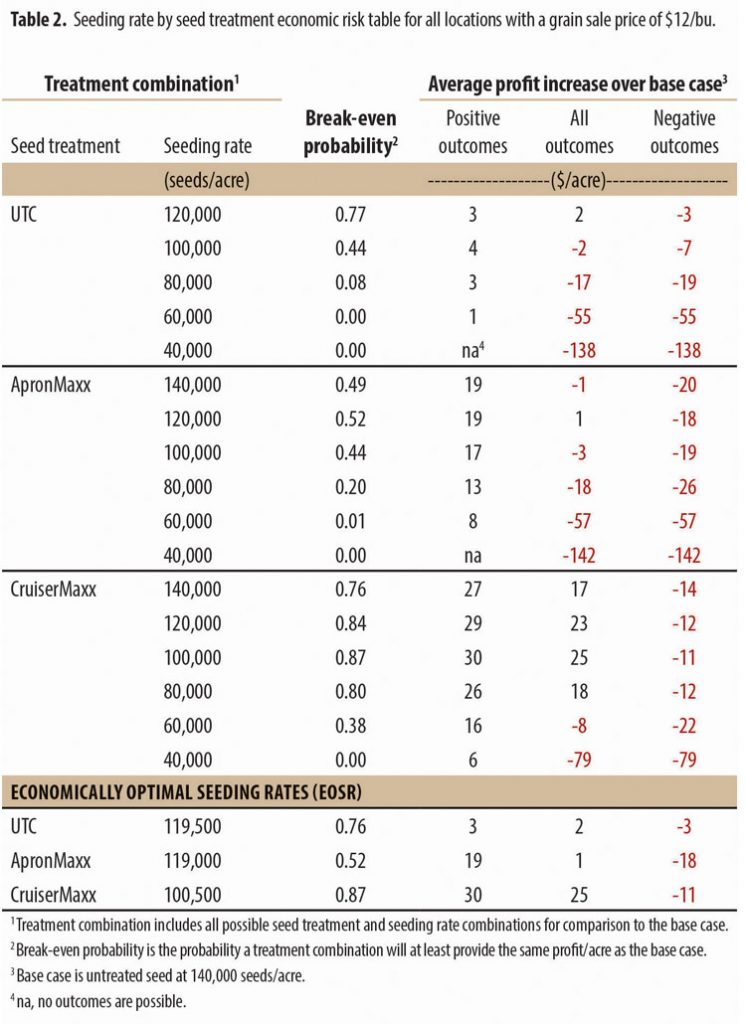
When the grain sale price was increased to $12 per bushel (Table 2), ApronMaxx and the UTC required higher seeding rates (greater than 120,000 seeds per acre) to achieve break-even probabilities greater than 0.50. Furthermore, we again saw trivial average profit increases for all outcomes (less than $2 per acre) with ApronMaxx and the UTC. The lowest risk ApronMaxx treatment combination (0.52) was at its EOSR. However, this only attained a $1 per acre average profit increase for all outcomes and a wide range of possibilities existed when accounting for the average positive ($19 per acre) and negative (-$18 per acre) outcomes. CruiserMaxx showed relatively high break-even probabilities (greater than 0.76) for seeding rates between 80,000 and 140,000 seeds per acre, with the lowest risk (0.87) and largest average profit increase for all outcomes ($25 per acre) at its EOSR (100,500 seeds per acre).
Conclusion and Recommendations
Our study found differences in yield, profitability and economic risk due to seed treatment and seeding rate. Growers should account for their expected grain sale price and seed treatment use when determining their seeding rate and additionally, the components of the seed treatment should be considered. We found that reducing seeding rates when using no seed treatment or a fungicide only seed treatment (ApronMaxx) might be too risky and provided minimal profit gains. In contrast, this study also showed that a fungicide/insecticide seed treatment (CruiserMaxx) reduced economic risk and increased profit across an array of environments, seeding rates (80,000 – 140,000 seeds per acre), and grain sale prices ($9–12 per bushel). Furthermore, to realize the lowest risk and highest profit increase with CruiserMaxx, producers should consider lowering their seeding rates to the EOSR according to their expected grain sale price. The EOSR for CruiserMaxx ranged from 94,000 to 101,000 seeds per acre and was on average, 16 percent (18,000 seeds per acre) less than ApronMaxx and the UTC across grain sale prices of $9–12 per bushel.
For more information, this research has been published in Crop Science with open access.
References
De Bruin, J.L. and P. Pedersen. 2008. Soybean seed yield response to planting date and seeding rate in the upper Midwest. Agron. J. 100: 696-703.
Epler, M. and S. Staggenborg. 2008. Soybean yield and yield component response to plant density in narrow row systems. Online. Crop Management doi:10.1094/CM-2008-0925-01-RS.
Esker, P. and S.P. Conley. 2012. Probability of yield response and breaking-even for soybean seed treatments. Crop Sci: 52:351-359.