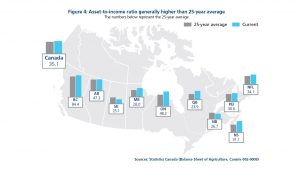
In well-functioning markets, the value of an asset is based on its income earning potential. For asset-to-income ratio, there’s no such standard because of its dependency on regional and provincial farm characteristics and mix of enterprises. Even though income accounting standards have evolved significantly, the most logical comparison of the asset-to-income ratio is over time, and not across provinces.
A ratio above its long-term average indicates assets are more expensive than the historical norm, while a lower ratio suggests the opposite.
The pace of appreciation in asset values at the national level has exceeded net farm cash income over the past several years. From 2001-2015, assets appreciated by 155% and net farm cash income appreciated by 85%.
A national overview
But the national picture hides some regional differences. Most provinces have a current asset-to-income ratio that is higher than the 25-year average. Notable exceptions are New Brunswick and Saskatchewan (see the figure below).
The greatest spreads between the 25-year average and current asset-to-income ratios are seen in Nova Scotia, Quebec and Manitoba. However, the current low interest rate environment, a weaker Canadian dollar and strong demand for agriculture commodities sustain the current value of assets relative to income. This suggests that overall, farm assets remain affordable relative to the historical trend in each province.
Net farm cash income can be volatile year-over-year and it is important to consider a multiyear view of the asset-to-income ratio. For additional insights into financial trends in Canadian agriculture, consult FCC Ag Economics Outlook for Farm Assets and Debt 2016-17.


